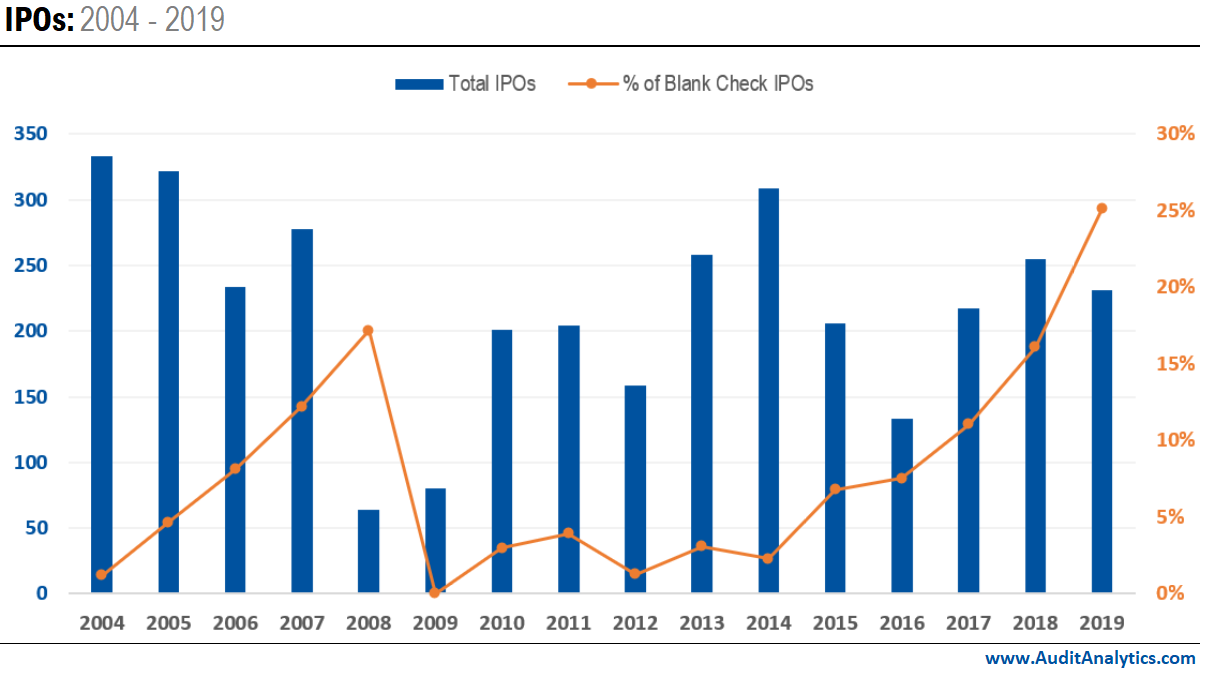
Going back to 2004, this post looks at longitudinal trends comparing standard initial public offerings (IPOs) and blank check IPOs, including the overall number of transactions, gross proceeds, auditor market share, and average accounting and legal fees.
A blank check is a euphemism for being granted unlimited freedom of action. In an initial public offering, a blank check company has a similar meaning: investors give money to a company without knowing exactly what the operations of the company will become.
A blank check company has no established business plan or operations, and can serve as a vessel to engage in a merger or acquisition with an unidentified company, entity, or other person.
A SPAC, or special purpose acquisition company, is a type of blank check company that has been receiving particular attention lately. SPACs have the sole purpose of raising capital through the process of an IPO in order to acquire or merge with an existing company.
Blank Check Initial Public Offerings
IPO formations are sensitive to outside factors, including economic stability, election cycles, interest rates, and overall stock market volatility. Due in part to these external factors, there have been significant fluctuations in the amount of IPOs conducted per year since 2004, for both standard IPOs and blank check IPOs.

The years immediately preceding the 2008 financial crisis saw the occurrence of blank check IPOs increase, reaching 17.2% of all IPOs in 2008. However, following the 2008 financial crisis, IPOs involving blank check companies sharply decreased. Part of this decrease could be attributed to fewer private companies overall seeking to go public during the economic unrest.
Despite the sharp decrease after 2008, blank check IPOs have not gone away and recently have experienced a significant resurgence. In 2019, 25.1% of all IPOs involved a blank check company.
Gross Proceeds
As the number of blank check IPOs increases, the gross proceeds raised from those offerings have also increased.

Between 2016 and 2019, the percentage of proceeds raised from blank check IPOs increased more than five-fold. In 2019, 19% of total gross proceeds for all IPOs came from blank check IPOs, contributing nearly $11.9 billion to the overall total of $63.0 billion.
Auditor Market Share
While blank check IPOs and SPACs have raised billions and can offer a quick public offering, the type of transaction can pose unique challenges, especially for auditors tasked with preparing the necessary filings. There are special considerations and nuances for these transactions and based on these complexities; it is not surprising that some audit firms have specialized teams for SPACs, while others prefer to focus business elsewhere.

Between 2004 and 2019, Big Four audit firms had slightly over 70% of the market share for all IPOs. However, when looking specifically at blank check IPOs during that same time period, the Big Four had just 6.5% of the blank check IPO market share.
Accounting and Legal Fees
Since costs have been named as a contributing factor to trends in the number of IPOs, we looked at the total accounting and legal fees for both standard IPOs and blank check IPOs.

Average fees fluctuate by year, but accounting and legal fees as a percentage of IPO proceeds for standard IPOs largely remains in the 0.8% range, with a peak around 1.5% in 2016. For blank check IPOs specifically, accounting and legal fees as a percentage of proceeds is consistently less than 0.5%, and since 2013, total fees have hovered below 0.3% of proceeds.
Considering the recent successes of blank check IPOs and SPACs, it is likely that this activity will continue to be seen in the future, provided continued economic stability.
The data in this analysis came from the Initial Public Offering database, powered by Audit Analytics.
For more information on this analysis, or to request a demo, please contact us.
