

In a recent edition of the Big Number, the Wall Street Journal’s Maxwell Murphy reported that 96% of S&P 500 companies disclosed in their 2015 proxy statements that they used a peer group to gauge executive pay.
Generally, peer groups used for benchmarking are arranged to reflect the target company in some way. Peers usually include close competitors, companies of a similar size and stature, regional companies, etc. But for whatever reason, there are a couple companies that seem to pop up over and over again. 3M, Honeywell, and Eaton, are cited as a peer by a surprising number of companies. Their popularity, according to research firm Equilar Inc., is largely attributed to their “breadth of operations or easily comparable company size”.
Using data collected by Audit Analytics, we analyzed the peer groups disclosed by the Russell 3000 composite companies and pulled the top-10 (including ties) most frequently named as a peer by others.
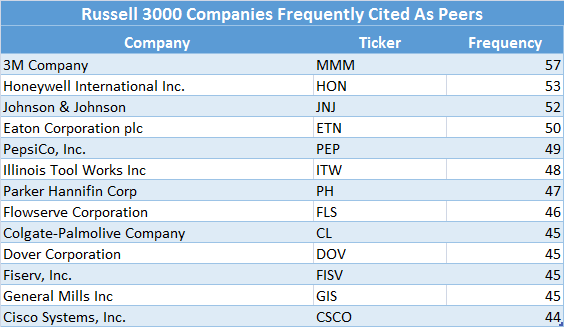
Consistent with the WSJ report on the S&P 500, 3M, Honeywell, and Eaton are also leaders of the Russell 3000 pack. And the rest of this list includes some of the largest and most respected companies in the world. Due to their size and prestige, it’s no surprise really that so many other companies would look to these leaders as a benchmark.
12 of the 13 are considered “manufacturing” companies according to their Standard Industrial Classification (SIC) codes. Not surprisingly, there are no Emerging Growth Companies here. All of the companies listed above are mature, established entities – more than half have been public companies since at least 1965.
There are outliers on the other side of this equation as well. The typical peer group for this index consists of 17 peers, but we came across a few companies that cited notably larger groups. The companies listed below named 100 or more compensation peers.
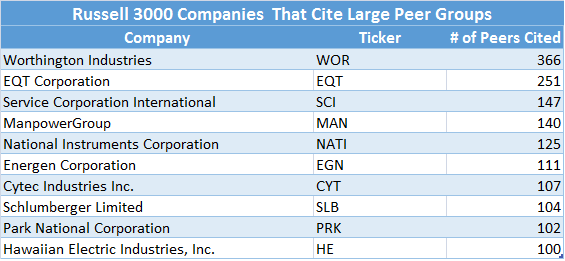
Worthington Industries’ extraordinarily large group has 366 peers in it. Next is EQT Corporation with 251 peers, followed by Service Corporation International and ManPowerGroup with 147 and 140 peers, respectively.
On the other side of the spectrum altogether are the companies that do not use any outside benchmarks at all. Around 80% of the Russell 3000 benchmark their compensation against outside peers, but some companies choose to use internal metrics instead. For example, Escalade Inc., whose brands include Ping-Pong® , Bear Archery® , and Whisker Biscuit®, does not compare executive salary levels to outside sources but rather takes into consideration the “…scope of and accountability associated with each executive officer’s position in addition to such factors as the performance and experience of each executive officer when setting base salary levels…”
What goes into selecting a company’s peer group? Let’s take a closer look at 3M’s proxy disclosure. Since, after all, so many companies cite the multi-national as their peer, their own peer selection criteria and subsequent Named Executive Officer (NEO) compensation are likely to serve as an example for many other companies.
In its March 2015 proxy statement, 3M disclosed using the following factors to select its compensation peer group:
- the peer companies are monitored regularly by the same market analysts who monitor the performance of 3M (investment peers).
- and/or the peer companies have similar business and pay models, market capitalization (based on an eight-quarter rolling average), and annual revenues.
Note that the criteria used to select peers is not limited to purely financial metrics such as market capitalization or revenue, but also includes so-called “investment peers” and companies with a similar business and pay model.
With respect to determining compensation, the company’s financial performance is a commonly considered factor. Union Bankshares Corp [UBSH], directly relates the two, stating that “the incentive programs are designed so that superior financial performance should result in pay higher than the Company’s peers while substandard financial performance should result in pay lower than its peers.”
Berkshire Hathaway, on the other hand, does not believe that performance should directly impact an executive’s pay. As stated in its executive compensation policy, “…neither the profitability of Berkshire nor the market value of its stock are to be considered in the compensation of any executive officer.”
Executive compensation is a sensitive and widely discussed topic. Over a two year period, the SEC received nearly 300,000 comments in connection with the 2013 proposed pay ratio rule. The controversy relating to CEO compensation peaked on August 5, 2015, when the Commission voted 3-2 in favor of the new rule. The amendment, which is effective for periods beginning after Jan 1, 2017, requires companies[1] to report the ratio between the CEO’s and the median employee’s compensation. The challenges of implementing this requirement, to name just a few, include gathering data from global subsidiaries and overseas divisions and dealings with restrictive data privacy laws in some of the countries.
On a lighter note, at the most recent National Association of Stock Plan Professionals’ (NASPP) Proxy Disclosure Conference in San Diego, some experts used simple, yet very creative, techniques to outline major provisions of the legislation. One inspiring presenter even used a Macklemore song to help make her point.
While it is not clear how the new pay ratio disclosure will affect compensation components, the NASPP predicts that we can expect to see landmark changes in 2016 which will impact every public company.
[1] According to the SEC, the disclosure requirement would apply to all companies required to provide executive compensation disclosure under Item 402(c)(2)(x) of Regulation S-K. Smaller reporting companies, foreign private issuers, MJDS filers, emerging growth companies, and registered investment companies would not be subject to the requirement.