
How much should an audit cost? The answer is not as simple as just charging an hourly rate. Many factors affect the overall cost of an audit: the amount of time and labor needed to perform the audit, the complexity of the company and its financials, and the potential risk or liability a firm takes on when they provide an audit.
The SEC requires registrants to disclose audit fee categories:
- Audit Fees: Fees necessary to perform the audit.
- Audit-Related Fees: Assurance and related services.
- Tax Fees: Tax compliance and tax planning/advice.
- Other Fees: All other auditor fees.
The S&P 500 is one of the most followed equity indices that tracks the 500 largest companies listed on exchanges in the United States. The average amount of total fees within the S&P 500 was close to $13.2 million in fiscal year 2021. With a median of $11.3 million and an overall range between $4.7 million and $17.7 million.
Considering there is substantial variation among audit and non-audit services, is it safe to assume that specific industries are more inclined to pay higher fees than others? Or that the bigger the company in terms of revenue, the more complicated the audit?
Audit Analytics recently released its annual Audit Fee Report, providing a comprehensive overview of trends in the SEC audit fee market. In this two-part blog analysis, we will focus on the audit and total fee trends paid by each industry of the S&P 500 companies, a subsection of the broader population covered in the report.
Industry Breakdown of S&P 500
The S&P 500 consists of different companies across varying industries. The chart below displays the composition of the current S&P 500 companies by industry gathered by our data, as classified by company-provided SIC codes. Manufacturing companies and Finance, Insurance and Real Estate companies cover almost 60% of the full index.

Since the S&P 500 is an index that tracks the stock performance of the top 500 largest companies, what is a better way to measure the leading industries than revenue? Did these industries also pay the highest total fees?

The chart above displays the percentage amount of revenue, total fee, and audit fees each industry contributed to the whole of the S&P 500 index. Manufacturing contributed the highest percentage in each category. In 2021, they contributed 35% towards the total revenue accumulated by the whole index. Consequently, Manufacturing paid 43% of both the total fees and audit fees paid by the entirety of the S&P 500.
Interestingly, total and audit fees paid by the Retail industry were incredibly low in comparison to the revenue they generated in 2021. Revenue in Retail increased from $2.04 trillion to $2.45 trillion from 2019 to 2021. Meanwhile, audit fees increased from $193.84 million to $201.8 million within the same time span. Total fees for Retail have also experienced an increase from $238.4 million in 2019 to $245.9 million in 2021.
During COVID-19 lockdowns, many retail stores closed their doors. Once opened, they had to limit the number of shoppers allowed to enter. However, online shopping surged during the pandemic. This change in consumer shopping grew in popularity, allowing the industry to flourish in terms of revenue.
Audit Fee in Relation to Revenue
The chart below quantifies audit fees across all industries as a percentage of their respective revenue in each year from 2019 to 2021.

Retail continued to have the lowest audit fees as percentage of revenue, as shown in our previous Audit Fees of the S&P 500 blog. However, nearly all industries across the board experienced a decline in 2021. These declines are related to decreases in revenue that occurred in 2020 due to the COVID-19 pandemic. After the pandemic, Mining and Manufacturing experienced the steepest decline in audit fees as percentage of revenue. This can be partially due to rebounds in their total revenues.
On the other hand, Finance, Insurance, and Real Estate companies, as well as companies in the Services industry, paid the highest amount of audit fees as a percentage of revenue in 2021.
To put it in perspective, General Motors [GM] paid $21.0 million in audit fees. This is just 0.0002% of the manufacturer’s $127.0 billion revenue in 2021. In comparison, finance company Morgan Stanley [MS] paid $60.6 million, which totaled 0.10% of their $59.8 billion revenue.
Fee Trends Between 2019-2021
The chart below investigates the total fees trend from 2019 to 2021. Where most industries’ fees tend to be stable, Manufacturing has seen a steady decline over the years. This is interesting, as the Manufacturing industry is the largest sector in the S&P 500 index and produces the highest percentage of the index’s total revenue.
The Finance, Insurance, and Real Estate industry experienced the opposite effect. Their total fees from 2019 to 2021 had a steady increase during the 3-year period. However, their revenue only increased by 0.06%.

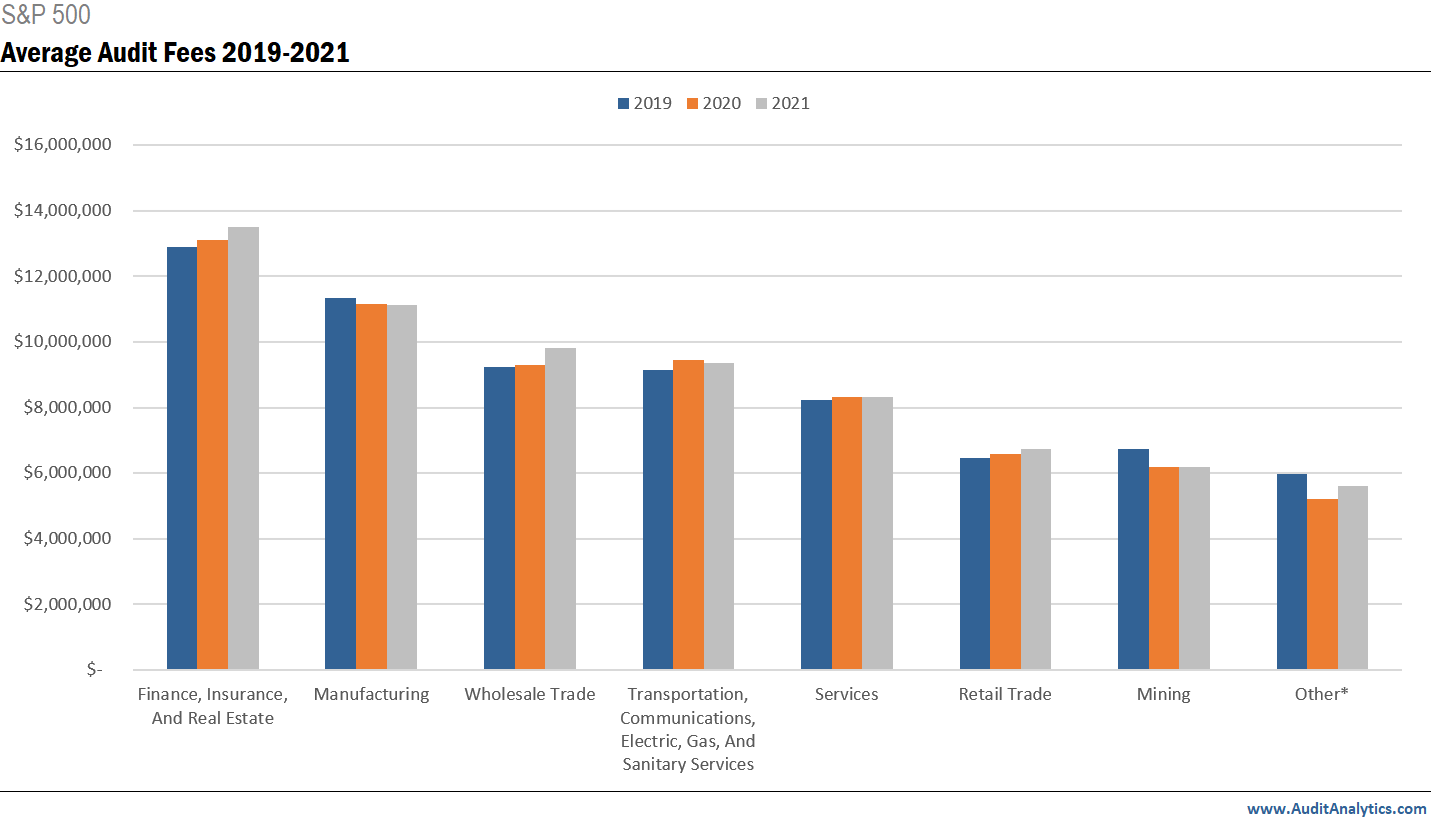
The average audit fee trend between 2019 and 2021 shown below seems to read similarly to total fees. The exception is that Finance, Insurance, and Real Estate pay the highest average audit fees across all industries instead of Manufacturing. Average audit fees for Finance companies have been trending upward since 2019. Wholesale Trade is seen to be paying higher amounts of average audit fees compared to other industries. This is surprising since they ranked in the bottom three industries in terms of total fees.
Stay tuned for Part 2 of this blog, which will analyze the breakdown of audit and non-audit fees paid by the S&P 500 as a whole and across the different industries it is composed of.
Interested in our content? Be sure to subscribe to receive our email notifications.