
With Twitter’s remarkable tweet announcing its filing with the SEC for a planned IPO, there’s been a flurry of discussion regarding the JOBS Act, especially the somewhat controversial designation of “Emerging Growth Companies”.
Back in February, Audit Analytics posted an analysis of accounting and legal fees for Emerging Growth Companies. An Emerging Growth Company (EGC) is defined as an issuer that completed the IPO process after December 8, 2011 with “total annual gross revenues” of less than $1 billion. Such companies are exempt from certain regulatory requirements, including certain aspects of the IPO (initial public offering) process. The hope was that, by lowering costs and regulatory burdens, these exemptions would help jumpstart the growth of smaller companies.
Based on that research, Audit Analytics found that companies that designated themselves as EGCs were, on average, subject to lower fees overall, but that EGCs had higher fees as a percentage of assets. Has this trend continued in 2013?
Between January 1 and June 30, 2013, 101 companies filed initial registration statements. 77 of these IPO companies (76.2%) designated themselves as Emerging Growth Companies. In comparison, 65.5% of the IPOs between April and December 2012 were filed by EGCs. That’s an increase of 16% in the percentage of companies that file for IPOs as Emerging Growth Companies, which seems to imply that the provision is popular.
The table below describes Accounting and Legal fees for the 101 companies that went public between January-June 2013:1
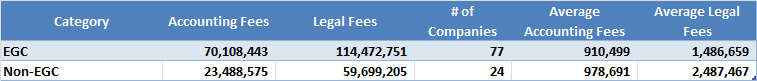
It appears as though the first part of the trend has continued into 2013, as one might expect. During this period, non-EGC filers on average still had higher Accounting and Legal IPO costs. Average accounting fees for EGC companies were about 7% lower than for non-EGC companies, while average legal fees were about 40% lower for EGC companies.
The table below presents a side-by-side comparison of our original analysis of 2012 IPO companies and the updated analysis for 2013:1

Interestingly, average accounting and legal fees were even lower for the 2013 EGC IPOs compared to the EGC IPOs in 2012. Average accounting and legal fees for the two sets of EGC companies decreased 13.9% and 12.5%, respectively. The 2013 batch of non-EGC IPO companies also had lower average accounting fees, with a decrease of nearly 17%. One major difference sticks out, however, which is that the 2013 non-EGC companies had a surprising increase in legal fees of almost 36%. This might be a one-off, though, since a glance over the detailed data suggests that this spike in legal fees can partially be explained by higher fees paid by a foreign issuer.
So far the data shows that EGC companies, as defined in the JOBS Act, continue to have lower average accounting and legal fees associated with IPOs. However, as we noted in our previous post on this topic, since EGC companies are primarily defined by size, non-EGC companies are typically larger and more established companies in comparison. Therefore, the higher average fees associated with non-EGC companies, as documented above, may be on account of the size and complexity of the company itself. That is to say, it might not imply higher compliance costs for the companies that don’t qualify for the EGC designation.
So, what happens when the size of these two types of companies is taken into consideration? The picture is again different, consistent with what we found back in February. When considered as a percentage of assets, accounting and legal fees are higher for EGC companies compared to non-EGC companies. The table below shows a side-by-side comparison of this analysis for IPOs in 2012 & 2013:1

As shown in the table, EGCs paid more in total fees as a percent of their assets in both 2012 and 2013. Not only did this trend continue into 2013, but the difference was amplified. Fees as a percentage of assets for EGC companies increased more than 50% from 2012 to 2013, while for non-EGCs fees as a percentage of assets decreased about 50% over the same period. In other words, fees as a percentage of assets were about 6 times higher for EGCs in 2012, and 19 times higher in 2013.
What does this tell us? It does not appear to be clear cut that filing as an EGC saves companies money. But more analysis would be required to get a fuller picture. Perhaps the smaller companies are more likely to be innovative tech companies, which often have complex accounting issues and could have more intangible assets, which might skew the ratio of fees-to-assets a little higher. Other factors might also help to explain this analysis. Feel free to add your thoughts below.
1. All fees in USD.↩