
Companies use peer groups to gain insight and help set executive pay ranges in comparison to its competitors. Generally, peer groups used for benchmarking are selected to reflect the target company in some way. Peers usually include close competitors or companies of a similar size, stature, or geographical location.
Each year, Audit Analytics analyzes all self-identified peer groups filed in DEF 14As and compiles a list of companies that cited the most number of peers and a list of those companies that were cited the most.
The leader of the Compensation Committee Leadership Network (CCLN), William Chandler, once referred to peer groups as “more an art than a science.”1 While a company’s criteria for assembling a peer group may differ, peer groups remain a popular tool for decision-making when it comes to establishing compensation.
Take Werner Enterprises, Inc. for instance, a company we noted as having one of the smallest peer groups in last year’s peer blog. This year, Werner Enterprises disclosed 15 peers, a jump from last year’s 3. In their disclosure they cited the criteria used for building their peer group as:
(i) companies naming Werner Enterprises as an executive compensation peer or Institutional Shareholder Services identifying the company as a pay for performance peer of Werner Enterprises, (ii) revenues, (iii) total shareholder return and (iv) industry of operation.
Werner Enterprises grew their peer group to meet the average amount of peers found in most companies, but that’s not to say there aren’t any outliers. While most companies tend to stick to 15 to 20 peers, some choose to name over a hundred companies in their peer group.
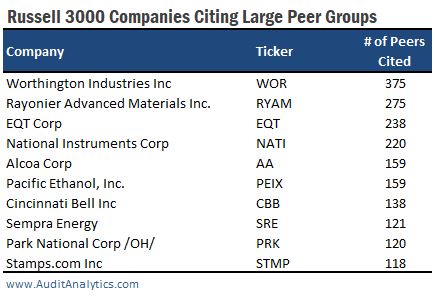
The table above shows the top ten companies having the most number of companies in their peer group. Many of these companies were also on the list last year, having gained or lost peers this year. Service Corporation International, for example, disclosed over 200 peers last year, but reduced their peer group to around 100 companies this year, citing refocusing as the primary reason for trimming down, according to their DEF 14A:
We do not believe the peer group used last year by Glass Lewis consisting of 67% restaurants was an appropriate comparison. These companies generally do not have a sales-centric focus like our preneed programs and several of the business models are asset light, while we are asset rich. We requested that consideration be given to a larger peer group of diversified companies of similar size in revenue, market capitalization, and enterprise value.
While some companies choose to grow their peer groups to meet industry norms, others like Service Corporation International decide to focus on market size instead of industry.
Switching gears a bit, we also looked at which companies were named most often as peers:

Looking at the table above, there are a few newcomers to the list: Idex Corp, Procter & Gamble Co, Dover Corp, and Crane Corp, all of which are manufacturing companies, keeping in trend with the other companies in the top ten. Additionally, the newcomers all became public roughly 30 years ago or more, lending more credence to why they might share ranking with the other companies that made the list.
While it may not be clear which approach yields the best results- a large peer group or small, one thing is for sure, peer groups continue to be used as an integral part of shaping executive compensation.
For more information on access to our peer benchmarking data, please contact us at info@auditanalytics.com or call (508) 476-7007.